The overview page
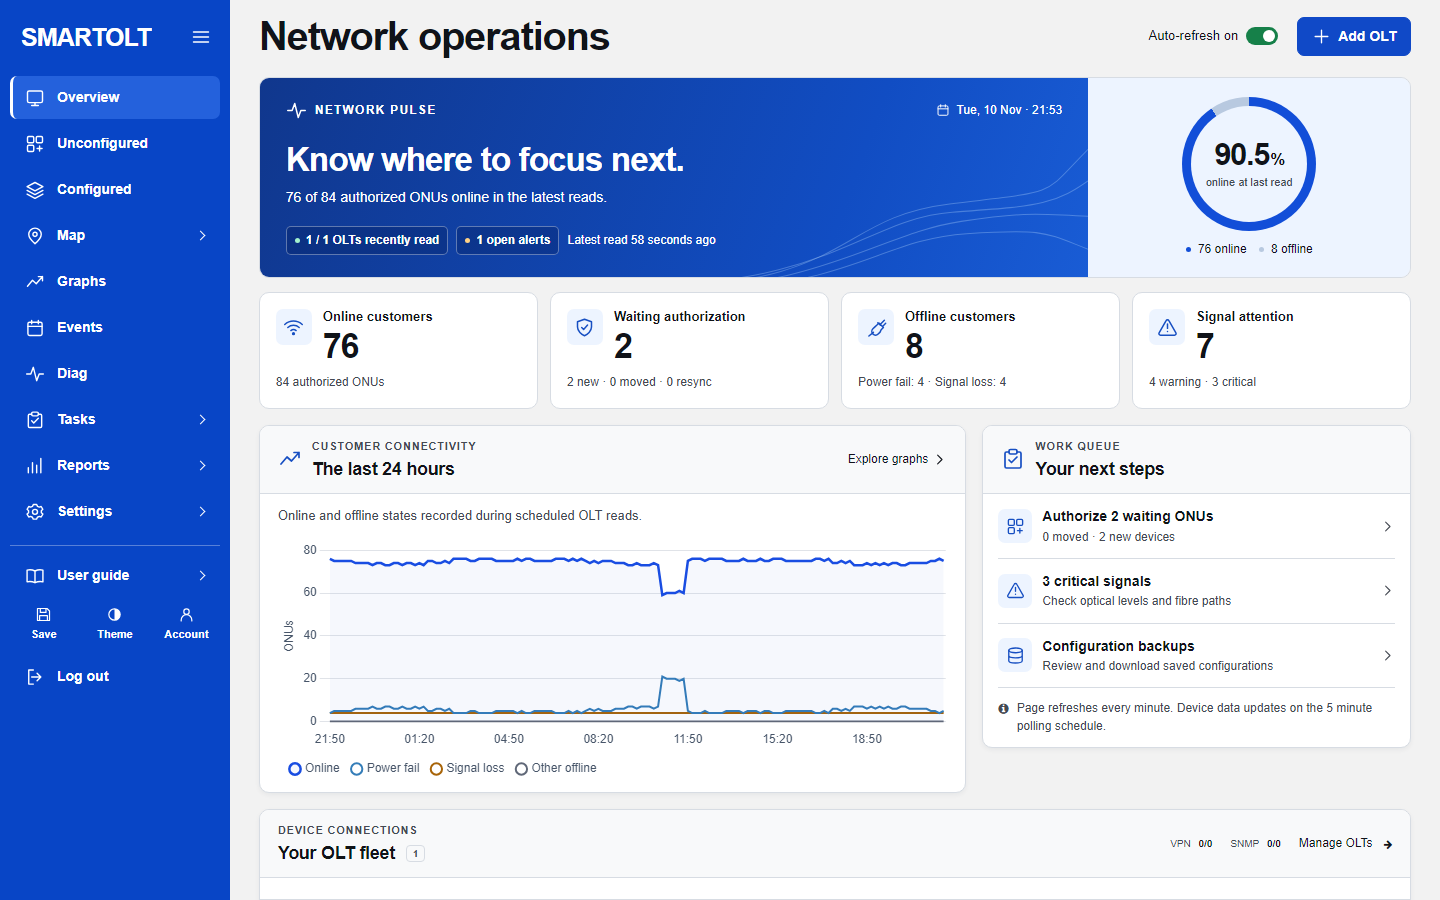
The Overview is the first page you see after you log in. Click Overview in the side menu to come back to it at any time. It shows the last data the panel received from your OLTs. Opening the page never changes anything on an OLT.
How often the data updates
- The panel reads each OLT every 5 minutes. It logs in to the OLT and reads the boards, every ONU with its status and signal, and the ONUs waiting for authorization.
- The page refreshes every minute. The Auto-refresh on switch at the top right controls this. Click it to turn the refresh off. Your browser remembers the choice.
The refresh only reloads the page. It does not read the OLT again. So a number can stay the same for up to 5 minutes, even if the page reloads. The page does not reload while you type in a field, while a dialog is open, or while a list in "PON & signal watch" is open.
If an OLT keeps failing, the panel tries it less often: every 15 minutes after 3 failed reads in a row, and once an hour after 12. If the OLT refuses the login, automatic reads stop until you correct the username or password. Press Refresh on the OLT to try at once.
Network pulse
The top panel is a summary of the whole network.
- The sentence under the heading tells you how many authorized ONUs were online in the latest reads, or how many OLTs need a successful recent read.
- OLTs recently read, for example "3 / 4 OLTs recently read". An OLT is "recently read" when its last read worked and is not older than 15 minutes.
- Open alerts: the number of ongoing events that are not muted. See Alarms and events.
- Latest read: how long ago the newest successful OLT read finished.
- The ring shows the share of authorized ONUs that were online at the last read, with the online and offline counts beside it.
When an OLT is not recently read, the customer numbers for that OLT are the last ones the panel received. They can be old. Check "Your OLT fleet" lower on the page to see which OLT has the problem.
The four customer cards
Each card is a link. Click it to open the matching list.
| Card | Big number | Small text | Click opens |
|---|---|---|---|
| Online customers | ONUs that are online | The total of authorized ONUs | Configured list, online ONUs only |
| Waiting authorization | ONUs plugged in but not authorized yet | new: serial never seen before. moved: serial that is already authorized somewhere, so the ONU was moved or plugged in again. resync: authorized ONUs whose setup on the OLT differs from the saved one. | The Unconfigured page |
| Offline customers | Authorized ONUs that are not online | Power fail: the ONU lost power. Signal loss: the light to the ONU is lost (LOS). | Configured list, offline ONUs only |
| Signal attention | ONUs with a weak or bad signal | warning: from -25 down to -27 dBm. critical: below -27 dBm, or above -8 dBm (too strong). | Configured list, weak signals only |
Power fail and Signal loss do not always add up to the offline number. Some ONUs are offline without a known cause, and disabled ONUs are offline too. For help with signal values, read the optical signal guide. To authorize waiting ONUs, read Authorize an ONU.
The last 24 hours
This chart shows how many ONUs were in each state at each scheduled OLT read: Online, Power fail, Signal loss and Other offline. A sharp drop of the Online line with a rise of Power fail at the same time usually means a power cut in an area. A rise of Signal loss usually means a fibre problem.
The chart needs at least two OLT reads before it can draw. Click Explore graphs to open the Graphs page with longer periods and one graph per PON port.
Your next steps
This is a short work list. Each line is a link.
- Connect an OLT: shown only when you have no OLT yet. See Add an OLT.
- Review N OLT connections: shown when one or more OLTs are failed, stale or not read yet. It jumps to "Your OLT fleet".
- Authorize N waiting ONUs (or Review ONU discovery when none are waiting): opens the Unconfigured page.
- N critical signals: opens the Configured list with only the ONUs that have a critical signal.
- Configuration backups: opens the backups page.
Your OLT fleet
One row per OLT, up to 8 rows. OLTs with a problem are listed first. If you have more than 8, click View all. The heading also shows two totals: VPN (connected tunnels out of configured tunnels) and SNMP (OLTs answering SNMP out of OLTs with SNMP enabled).
| Column | What it shows |
|---|---|
| Device | The OLT name, model and IP address. Click it to open the OLT. |
| Customer ONUs | Online ONUs and authorized ONUs on this OLT. |
| Telnet read | Recent read: the last read worked and is 15 minutes old or less. Stale: the last read is older than 15 minutes. Failed: the last read failed. Hold the mouse over the label to see the error. Not read: the OLT has never been read. |
| SNMP | Not enabled, Responding, Partial read, Failed, Stale or Not read. Click it to open the Uplink tab of the OLT. |
| Connection | Direct, or the state of the VPN tunnel: VPN connected, VPN offline or VPN unavailable. |
| Last read | How long ago the panel last tried to read the OLT, or Never. |
If an OLT shows Failed or VPN offline, read Connection troubleshooting.
PON & signal watch
Five lists that you open with a click. The number beside each name is how many items it holds.
| List | What is in it | Usual cause |
|---|---|---|
| Signal variations | ONUs whose signal is now 3 dB or more below their own average of the last week. | A dirty connector or a bent fibre. |
| Partial LOS | PON ports with two or more ONUs in LOS, but not all of them down. | A splitter or a drop cable. |
| Full PON LOS | PON ports where every ONU is offline and at least one reports LOS. | A feeder fibre cut. |
| Power fail | PON ports with two or more ONUs in power fail. | A power cut in the area. |
| Offline N/A | ONUs that are offline without a known cause. | Check the ONU itself. |
Under the lists, Open alerts shows up to four ongoing events. Click All events to open the Events page.
OLT overview
Choose an OLT in the selector to see its picture, model, Uptime, Temperature and Boards found. The label says Recently read or Check connection. Three links are under it: Open device opens the OLT page, Diagnostics opens the Diag page for this OLT, and Settings opens the OLT settings form.
New authorizations and Recent activity
- New authorizations: a bar for each of the last 14 days with the number of ONUs authorized through the panel. Click 14 day report to open the Authorizations report.
- Recent activity: the last six changes, for example an ONU authorized or a configuration saved, with who did it. Successful scheduled reads are left out. Click View all to open the full activity log.
Still stuck? Write to us and include your site name. No panel yet? Create one for free.